


Table
| # | Team | Pts | P | W | D | L | |
|---|---|---|---|---|---|---|---|
| 2 |
 New England |
58 | 32 | 18 | 4 | 10 | |
| 3 |
 Inter Miami |
56 | 32 | 15 | 11 | 6 |
Your content after this ad
Your content after this ad
Current form
W
W
W
W
L
D
L
W
W
W
Last matches
26/04/26
Inter Miami
1
New England
1
05/10/25
Inter Miami
4
New England
1
10/07/25
New England
1
Inter Miami
2
19/10/24
Inter Miami
6
New England
2
28/04/24
New England
1
Inter Miami
4
Referees
-
Ricardo Montero main referee3.90.4Average card count per match for 14 matches arbitrated
- Joshua Patlak VAR referee
- Serhii Boiko fourth referee
- Corey Michael Parker assistant referee
- Ryan Christopher Graves assistant referee
- Younes Marrakchi VAR assistant referee
Your content after this ad
Your content after this ad
Injured players

Match venue
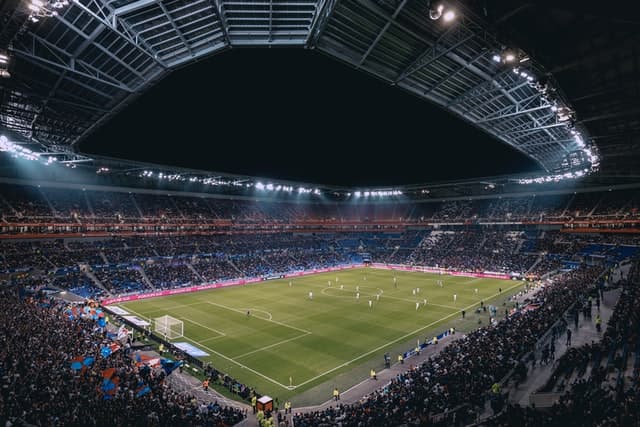
Gillette Stadium - Foxborough, Massachusetts
- Year of construction: 2002
- Surface: artificial
- Capacity: 64628
- Average attendance: 36030
- Maximum attendance: 65612
- % sold: 60
Match in live New England Inter Miami
- Date 02 November 2026 00:00
- Competition MLS
- Season 2026
- Stage Regular Season
- Code NE-MIA
- Area United-states
- Home team New England
- Away team Inter Miami
FAQ
Who is the referee of the match New England Inter Miami ?
Ricardo Montero is the referee for this match
Where is the match New England Inter Miami?
The venue Gillette Stadium in Foxborough, Massachusetts is hosting the match
At what time is New England Inter Miami?
Fixture in live on Football Today on 02 November 2026. Kick-off at 00:00
Your content after this ad
Your content after this ad
Regular Season - Eastern Conference
Table by group
| # | Team | Pts | P | W | D | L | GF | GA | GD | |
|---|---|---|---|---|---|---|---|---|---|---|
| 1 |
 Nashville |
71 | 32 | 21 | 8 | 3 | 66 | 23 | 43 | |
| 2 |
New England
|
58 | 32 | 18 | 4 | 10 | 54 | 44 | 10 | |
| 3 |
Inter Miami
|
56 | 32 | 15 | 11 | 6 | 75 | 55 | 20 | |
| 4 |
 Chicago |
55 | 33 | 16 | 7 | 10 | 61 | 50 | 11 | |
| 5 |
 Charlotte |
53 | 33 | 15 | 8 | 10 | 63 | 48 | 15 | |
| 6 |
 Philadelphia |
47 | 33 | 13 | 8 | 12 | 62 | 51 | 11 | |
| 7 |
 Cincinnati |
46 | 33 | 12 | 10 | 11 | 67 | 73 | -6 | |
| 8 |
 Columbus |
44 | 33 | 13 | 5 | 15 | 55 | 49 | 6 | |
| 9 |
 Orlando |
43 | 33 | 12 | 7 | 14 | 62 | 78 | -16 | |
| 10 |
 New York |
39 | 32 | 11 | 6 | 15 | 43 | 59 | -16 | |
| 11 |
 NYCFC |
39 | 33 | 9 | 12 | 12 | 48 | 45 | 3 | |
| 12 |
 Toronto |
39 | 32 | 9 | 12 | 11 | 50 | 60 | -10 | |
| 13 |
 DC United |
33 | 33 | 7 | 12 | 14 | 39 | 60 | -21 | |
| 14 |
 Atlanta United |
30 | 32 | 8 | 6 | 18 | 40 | 56 | -16 | |
| 15 |
 Montréal |
26 | 33 | 6 | 8 | 19 | 37 | 67 | -30 |
| # | Team | Pts | P | W | D | L | GF | GA | GD |
|---|---|---|---|---|---|---|---|---|---|
| 1 |
Nashville
|
44 | 16 | 14 | 2 | 0 | 45 | 12 | 33 |
| 2 |
New England
|
35 | 16 | 11 | 2 | 3 | 30 | 18 | 12 |
| 3 |
Charlotte
|
34 | 17 | 10 | 4 | 3 | 37 | 16 | 21 |
| 4 |
Orlando
|
30 | 16 | 9 | 3 | 4 | 32 | 22 | 10 |
| 5 |
Cincinnati
|
30 | 16 | 9 | 3 | 4 | 39 | 30 | 9 |
| 6 |
Columbus
|
29 | 17 | 9 | 2 | 6 | 29 | 19 | 10 |
| 7 |
Chicago
|
29 | 16 | 9 | 2 | 5 | 30 | 21 | 9 |
| 8 |
Toronto
|
27 | 17 | 6 | 9 | 2 | 36 | 33 | 3 |
| 9 |
Philadelphia
|
26 | 16 | 7 | 5 | 4 | 28 | 18 | 10 |
| 10 |
Inter Miami
|
26 | 16 | 6 | 8 | 2 | 43 | 28 | 15 |
| 11 |
New York
|
21 | 16 | 6 | 3 | 7 | 24 | 29 | -5 |
| 12 |
NYCFC
|
21 | 17 | 5 | 6 | 6 | 30 | 24 | 6 |
| 13 |
DC United
|
20 | 16 | 5 | 5 | 6 | 20 | 28 | -8 |
| 14 |
Montréal
|
17 | 16 | 4 | 5 | 7 | 19 | 23 | -4 |
| 15 |
Atlanta United
|
14 | 16 | 4 | 2 | 10 | 23 | 32 | -9 |
| # | Team | Pts | P | W | D | L | GF | GA | GD |
|---|---|---|---|---|---|---|---|---|---|
| 1 |
Inter Miami
|
30 | 16 | 9 | 3 | 4 | 32 | 27 | 5 |
| 2 |
Nashville
|
27 | 16 | 7 | 6 | 3 | 21 | 11 | 10 |
| 3 |
Chicago
|
26 | 17 | 7 | 5 | 5 | 31 | 29 | 2 |
| 4 |
New England
|
23 | 16 | 7 | 2 | 7 | 24 | 26 | -2 |
| 5 |
Philadelphia
|
21 | 17 | 6 | 3 | 8 | 34 | 33 | 1 |
| 6 |
Charlotte
|
19 | 16 | 5 | 4 | 7 | 26 | 32 | -6 |
| 7 |
New York
|
18 | 16 | 5 | 3 | 8 | 19 | 30 | -11 |
| 8 |
NYCFC
|
18 | 16 | 4 | 6 | 6 | 18 | 21 | -3 |
| 9 |
Atlanta United
|
16 | 16 | 4 | 4 | 8 | 17 | 24 | -7 |
| 10 |
Cincinnati
|
16 | 17 | 3 | 7 | 7 | 28 | 43 | -15 |
| 11 |
Columbus
|
15 | 16 | 4 | 3 | 9 | 26 | 30 | -4 |
| 12 |
Orlando
|
13 | 17 | 3 | 4 | 10 | 30 | 56 | -26 |
| 13 |
DC United
|
13 | 17 | 2 | 7 | 8 | 19 | 32 | -13 |
| 14 |
Toronto
|
12 | 15 | 3 | 3 | 9 | 14 | 27 | -13 |
| 15 |
Montréal
|
9 | 17 | 2 | 3 | 12 | 18 | 44 | -26 |
| # | Team | Pts | P | W | D | L | GF | GA | GD |
|---|---|---|---|---|---|---|---|---|---|
| 1 |
Nashville
|
62 | 32 | 16 | 14 | 2 | 30 | 9 | 21 |
| 2 |
Inter Miami
|
52 | 32 | 12 | 16 | 4 | 36 | 23 | 13 |
| 3 |
Columbus
|
51 | 33 | 14 | 9 | 10 | 29 | 23 | 6 |
| 4 |
NYCFC
|
51 | 33 | 13 | 12 | 8 | 28 | 19 | 9 |
| 5 |
Charlotte
|
51 | 33 | 13 | 12 | 8 | 26 | 22 | 4 |
| 6 |
New England
|
48 | 32 | 14 | 6 | 12 | 24 | 23 | 1 |
| 7 |
Chicago
|
48 | 33 | 12 | 12 | 9 | 25 | 23 | 2 |
| 8 |
Orlando
|
43 | 33 | 12 | 7 | 14 | 25 | 34 | -9 |
| 9 |
DC United
|
40 | 33 | 10 | 10 | 13 | 18 | 24 | -6 |
| 10 |
New York
|
39 | 32 | 10 | 9 | 13 | 20 | 23 | -3 |
| 11 |
Philadelphia
|
37 | 33 | 9 | 10 | 14 | 19 | 27 | -8 |
| 12 |
Atlanta United
|
37 | 32 | 8 | 13 | 11 | 16 | 21 | -5 |
| 13 |
Montréal
|
36 | 33 | 8 | 12 | 13 | 19 | 25 | -6 |
| 14 |
Cincinnati
|
35 | 33 | 7 | 14 | 12 | 27 | 32 | -5 |
| 15 |
Toronto
|
24 | 32 | 4 | 12 | 16 | 13 | 28 | -15 |
Your content after this ad
Your content after this ad
Head to head
All time head-to-head
27%
3 win
9%
1 draw
64%
7 win
Last matches
All matches
26/04/26
Inter Miami
1
New England
1
05/10/25
Inter Miami
4
New England
1
10/07/25
New England
1
Inter Miami
2
19/10/24
Inter Miami
6
New England
2
28/04/24
New England
1
Inter Miami
4
Goal stats within the 11 head to head
All stats
9%
(1)
No goal scored
(2)
18%
91%
(10)
At least 1 goal scored
(9)
82%
45%
(5)
More than 1.5 goals scored
(6)
55%
18%
(2)
More than 2.5 goals scored
(4)
36%
9%
(1)
More than 3.5 goals scored
(3)
27%
9%
(1)
More than 4.5 goals scored
(1)
9%
Goals per time segment in 11 matches
More stats
0-15 min.
5
1
16-30 min.
3
3
31-45+ min.
4
7
46-60 min.
3
3
61-75 min.
2
3
76-90+ min.
2
7
Current form
All matches
W
W
W
W
L
D
L
W
W
W
Last matches
All matches
28/10/26
New England
3
New York
2
25/10/26
Philadelphia
1
New England
2
18/10/26
New England
1
Chicago
0
15/10/26
Cincinnati
2
New England
3
11/10/26
New England
0
 Sounders
3
28/10/26
Inter Miami
2
Cincinnati
2
24/10/26
New York
2
Inter Miami
0
18/10/26
Atlanta United
1
Inter Miami
3
15/10/26
Inter Miami
2
NYCFC
0
11/10/26
Inter Miami
4
DC United
0
Stats in MLS
All stats
54
Goals
75
44
Goals Conceded
55
3
Penalty Goals Conceded
7
6
Clean Sheets
6
49%
Possession Percentage
57%
87%
Passing Accuracy
87%