

Highlights
Substitutions
Table
Line-ups
 4-3-3

Stats
Player stats

- 2
- 2
- 1
- 1
- 3
- 3
- 3
- 3
- 4
- 2
- 3
- 58
- 54
- 49
- 47
Current form
Last matches
-
Drew Thomas Fischer main referee4.10.2Average card count per match for 22 matches arbitrated
- Lyes Arfa assistant referee
- José Carlos Rivero VAR assistant referee
- Micheal Andrew Barwegen assistant referee
- Thomas Zablocki VAR referee
- Iwan-Nikita Jecanski fourth referee

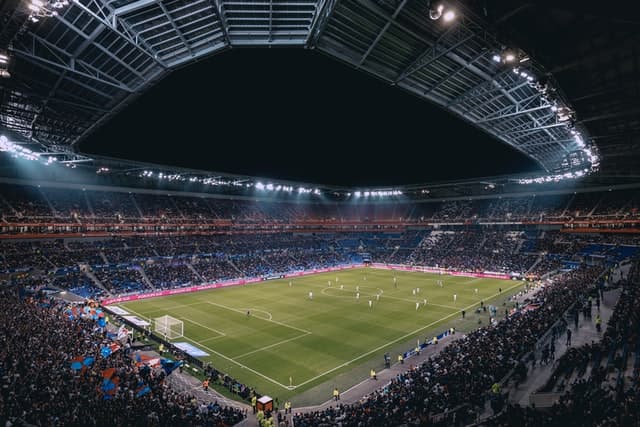
- Year of construction: 2007
- Surface: grass
- Capacity: 45736
- Average attendance: 25495
- Maximum attendance: 44828
- % sold: 64
Match result Toronto Austin
- Date 18 April 2026 18:00
- Competition MLS
- Season 2026
- Stage Regular Season
- Match attendance 16550
- Code TOR-ATX
- Area United-states
- Home team Toronto
- Away team Austin
What is the result between Toronto Austin?
The match resulted in a 3-3 draw between the two teams
What are the official lineups for Toronto Austin?
Toronto : Coached by R. Fraser, the lineup starts off in a 4-3-3 formation: L. Gavran, R. Edwards, Z. Monlouis, Alonso Coello, R. Laryea, J. Osorio (C), J. Cifuentes, K. Franklin, D. Sallói, D. Etienne, J. Sargent
Austin : On the other side of the pitch, the team trained by Nico Estévez, is positioning themselves in a 4-4-2 : B. Stuver (C), Guilherme Biro, J. Bell, O. Svatok, M. Desler, J. Nelson, J. Rosales, N. Dubersarsky, J. Gallagher, M. Uzuni, F. Torres
Who is the referee of the match Toronto Austin ?
Drew Thomas Fischer is the referee for this match
Where is the match Toronto Austin?
The venue BMO Field in Toronto, Ontario is hosting the match
At what time is Toronto Austin?
Fixture in live on Football Today on 18 April 2026. Kick-off at 18:00
Toronto
4-3-3
-
-
1
L. Gavran
-
44
R. Edwards
-
12
Z. Monlouis
-
14
Alonso Coello
-
22
R. Laryea
-
21
(C)
J. Osorio
-
8
J. Cifuentes
-
19
K. Franklin
-
20
D. Sallói
-
11
D. Etienne
-
9
J. Sargent
-
1
L. Gavran
-
-
1
(C)
B. Stuver
-
29
Guilherme Biro
-
15
J. Bell
-
5
O. Svatok
-
3
M. Desler
-
7
J. Nelson
-
30
J. Rosales
-
20
N. Dubersarsky
-
17
J. Gallagher
-
10
M. Uzuni
-
11
F. Torres
-
1
(C)
B. Stuver
Austin
4-4-2
-
-
R. Fraser Coach
-
M. Cimermančič
#71
-
-
J. Vilsaint
#99
-
-
J. Gilman
#38
-
-
L. Stefanovic #76 -62'
-
W. Yarbrough
#23
-
-
D. Kerr
#29
-
-
M. Henry #78 -62'
-
E. Aristizábal #17 -90+4'
-
R. Fisher
#75
-
-
-
-
Nico Estévez Coach
-
M. Đorđević
#35
-
-
R. Taylor #16 -57'
-
Ž. Kolmanič
#23
-
-
B. Šabović #14 -71'
-
Ilie Sánchez #6 -90+3'
-
D. Las
#12
-
-
C. Ramirez #21 -71'
-
C. Fodrey #19 -90+4'
-
E. Torres
#38
-
-
- 75% (3/4)
- 67% (2/3)
- 67% (2/3)
- 50% (2/4)
- 3
- 3
- 3
- 2
- 91% (40/44)
- 88% (44/50)
- 87% (34/39)
- 87% (47/54)
| # | Team | Pts | P | W | D | L | GF | GA | GD | |
|---|---|---|---|---|---|---|---|---|---|---|
| 1 |
 Nashville |
77 | 34 | 23 | 8 | 3 | 71 | 25 | 46 | |
| 2 |
 Inter Miami |
60 | 34 | 16 | 12 | 6 | 80 | 59 | 21 | |
| 3 |
 New England |
58 | 34 | 18 | 4 | 12 | 55 | 47 | 8 | |
| 4 |
 Chicago |
55 | 34 | 16 | 7 | 11 | 64 | 54 | 10 | |
| 5 |
 Charlotte |
54 | 34 | 15 | 9 | 10 | 66 | 51 | 15 | |
| 6 |
 Philadelphia |
50 | 34 | 14 | 8 | 12 | 66 | 52 | 14 | |
| 7 |
 Columbus |
47 | 34 | 14 | 5 | 15 | 59 | 52 | 7 | |
| 8 |
 Orlando |
46 | 34 | 13 | 7 | 14 | 63 | 78 | -15 | |
| 9 |
 Cincinnati |
46 | 34 | 12 | 10 | 12 | 67 | 75 | -8 | |
| 10 |
 New York |
42 | 34 | 12 | 6 | 16 | 48 | 62 | -14 | |
| 11 |
 NYCFC |
42 | 34 | 10 | 12 | 12 | 49 | 45 | 4 | |
| 12 |
 Toronto |
39 | 34 | 9 | 12 | 13 | 52 | 67 | -15 | |
| 13 |
 Atlanta United |
33 | 34 | 9 | 6 | 19 | 43 | 60 | -17 | |
| 14 |
 DC United |
33 | 34 | 7 | 12 | 15 | 39 | 61 | -22 | |
| 15 |
 Montréal |
26 | 34 | 6 | 8 | 20 | 37 | 69 | -32 |
| # | Team | Pts | P | W | D | L | GF | GA | GD |
|---|---|---|---|---|---|---|---|---|---|
| 1 |
Nashville
|
47 | 17 | 15 | 2 | 0 | 48 | 14 | 34 |
| 2 |
New England
|
35 | 17 | 11 | 2 | 4 | 31 | 20 | 11 |
| 3 |
Charlotte
|
34 | 17 | 10 | 4 | 3 | 37 | 16 | 21 |
| 4 |
Orlando
|
33 | 17 | 10 | 3 | 4 | 33 | 22 | 11 |
| 5 |
Cincinnati
|
30 | 17 | 9 | 3 | 5 | 39 | 32 | 7 |
| 6 |
Columbus
|
29 | 17 | 9 | 2 | 6 | 29 | 19 | 10 |
| 7 |
Chicago
|
29 | 17 | 9 | 2 | 6 | 33 | 25 | 8 |
| 8 |
Philadelphia
|
29 | 17 | 8 | 5 | 4 | 32 | 19 | 13 |
| 9 |
Inter Miami
|
27 | 17 | 6 | 9 | 2 | 46 | 31 | 15 |
| 10 |
Toronto
|
27 | 17 | 6 | 9 | 2 | 36 | 33 | 3 |
| 11 |
New York
|
24 | 17 | 7 | 3 | 7 | 27 | 29 | -2 |
| 12 |
NYCFC
|
21 | 17 | 5 | 6 | 6 | 30 | 24 | 6 |
| 13 |
DC United
|
20 | 17 | 5 | 5 | 7 | 20 | 29 | -9 |
| 14 |
Atlanta United
|
17 | 17 | 5 | 2 | 10 | 26 | 33 | -7 |
| 15 |
Montréal
|
17 | 17 | 4 | 5 | 8 | 19 | 25 | -6 |
| # | Team | Pts | P | W | D | L | GF | GA | GD |
|---|---|---|---|---|---|---|---|---|---|
| 1 |
Inter Miami
|
33 | 17 | 10 | 3 | 4 | 34 | 28 | 6 |
| 2 |
Nashville
|
30 | 17 | 8 | 6 | 3 | 23 | 11 | 12 |
| 3 |
Chicago
|
26 | 17 | 7 | 5 | 5 | 31 | 29 | 2 |
| 4 |
New England
|
23 | 17 | 7 | 2 | 8 | 24 | 27 | -3 |
| 5 |
Philadelphia
|
21 | 17 | 6 | 3 | 8 | 34 | 33 | 1 |
| 6 |
NYCFC
|
21 | 17 | 5 | 6 | 6 | 19 | 21 | -2 |
| 7 |
Charlotte
|
20 | 17 | 5 | 5 | 7 | 29 | 35 | -6 |
| 8 |
Columbus
|
18 | 17 | 5 | 3 | 9 | 30 | 33 | -3 |
| 9 |
New York
|
18 | 17 | 5 | 3 | 9 | 21 | 33 | -12 |
| 10 |
Atlanta United
|
16 | 17 | 4 | 4 | 9 | 17 | 27 | -10 |
| 11 |
Cincinnati
|
16 | 17 | 3 | 7 | 7 | 28 | 43 | -15 |
| 12 |
Orlando
|
13 | 17 | 3 | 4 | 10 | 30 | 56 | -26 |
| 13 |
DC United
|
13 | 17 | 2 | 7 | 8 | 19 | 32 | -13 |
| 14 |
Toronto
|
12 | 17 | 3 | 3 | 11 | 16 | 34 | -18 |
| 15 |
Montréal
|
9 | 17 | 2 | 3 | 12 | 18 | 44 | -26 |
| # | Team | Pts | P | W | D | L | GF | GA | GD |
|---|---|---|---|---|---|---|---|---|---|
| 1 |
Nashville
|
63 | 34 | 16 | 15 | 3 | 31 | 11 | 20 |
| 2 |
Inter Miami
|
56 | 34 | 13 | 17 | 4 | 39 | 23 | 16 |
| 3 |
NYCFC
|
52 | 34 | 13 | 13 | 8 | 28 | 19 | 9 |
| 4 |
Columbus
|
51 | 34 | 14 | 9 | 11 | 31 | 26 | 5 |
| 5 |
Chicago
|
51 | 34 | 13 | 12 | 9 | 28 | 25 | 3 |
| 6 |
Charlotte
|
51 | 34 | 13 | 12 | 9 | 26 | 25 | 1 |
| 7 |
New England
|
49 | 34 | 14 | 7 | 13 | 24 | 24 | 0 |
| 8 |
Orlando
|
46 | 34 | 13 | 7 | 14 | 26 | 34 | -8 |
| 9 |
New York
|
45 | 34 | 12 | 9 | 13 | 23 | 24 | -1 |
| 10 |
DC United
|
41 | 34 | 10 | 11 | 13 | 18 | 24 | -6 |
| 11 |
Philadelphia
|
40 | 34 | 10 | 10 | 14 | 21 | 28 | -7 |
| 12 |
Atlanta United
|
40 | 34 | 9 | 13 | 12 | 18 | 22 | -4 |
| 13 |
Montréal
|
37 | 34 | 8 | 13 | 13 | 19 | 25 | -6 |
| 14 |
Cincinnati
|
36 | 34 | 7 | 15 | 12 | 27 | 32 | -5 |
| 15 |
Toronto
|
24 | 34 | 4 | 12 | 18 | 14 | 32 | -18 |
| # | Team | Pts | P | W | D | L | GF | GA | GD | |
|---|---|---|---|---|---|---|---|---|---|---|
| 1 |
 Whitecaps |
64 | 34 | 19 | 7 | 8 | 74 | 34 | 40 | |
| 2 |
 Dallas |
58 | 34 | 16 | 10 | 8 | 62 | 51 | 11 | |
| 3 |
 St. Louis |
54 | 34 | 15 | 9 | 10 | 59 | 48 | 11 | |
| 4 |
 Earthquakes |
52 | 34 | 14 | 10 | 10 | 57 | 51 | 6 | |
| 5 |
 Houston |
51 | 34 | 14 | 9 | 11 | 43 | 43 | 0 | |
| 6 |
 LAFC |
47 | 34 | 12 | 11 | 11 | 52 | 40 | 12 | |
| 7 |
 Portland |
46 | 34 | 13 | 7 | 14 | 62 | 61 | 1 | |
| 8 |
 Sounders |
46 | 34 | 12 | 10 | 12 | 44 | 46 | -2 | |
| 9 |
 Salt Lake |
45 | 34 | 13 | 6 | 15 | 53 | 52 | 1 | |
| 10 |
 Minnesota |
44 | 34 | 11 | 11 | 12 | 56 | 58 | -2 | |
| 11 |
 Galaxy |
44 | 34 | 11 | 11 | 12 | 50 | 57 | -7 | |
| 12 |
 Colorado |
43 | 34 | 12 | 7 | 15 | 47 | 50 | -3 | |
| 13 |
 San Diego |
38 | 34 | 9 | 11 | 14 | 57 | 63 | -6 | |
| 14 |
 Austin |
34 | 34 | 8 | 10 | 16 | 42 | 65 | -23 | |
| 15 |
 Sporting KC |
26 | 34 | 7 | 5 | 22 | 40 | 81 | -41 |
| # | Team | Pts | P | W | D | L | GF | GA | GD |
|---|---|---|---|---|---|---|---|---|---|
| 1 |
Whitecaps
|
35 | 17 | 11 | 2 | 4 | 44 | 16 | 28 |
| 2 |
Colorado
|
33 | 17 | 10 | 3 | 4 | 31 | 19 | 12 |
| 3 |
Salt Lake
|
33 | 17 | 10 | 3 | 4 | 33 | 22 | 11 |
| 4 |
Dallas
|
32 | 17 | 9 | 5 | 3 | 32 | 23 | 9 |
| 5 |
LAFC
|
31 | 17 | 9 | 4 | 4 | 32 | 18 | 14 |
| 6 |
St. Louis
|
31 | 17 | 9 | 4 | 4 | 36 | 23 | 13 |
| 7 |
Portland
|
31 | 17 | 9 | 4 | 4 | 37 | 28 | 9 |
| 8 |
Houston
|
29 | 17 | 8 | 5 | 4 | 19 | 15 | 4 |
| 9 |
Sounders
|
28 | 17 | 8 | 4 | 5 | 26 | 23 | 3 |
| 10 |
Galaxy
|
27 | 17 | 7 | 6 | 4 | 26 | 21 | 5 |
| 11 |
Earthquakes
|
26 | 17 | 7 | 5 | 5 | 30 | 26 | 4 |
| 12 |
San Diego
|
23 | 17 | 6 | 5 | 6 | 37 | 30 | 7 |
| 13 |
Minnesota
|
22 | 17 | 5 | 7 | 5 | 25 | 22 | 3 |
| 14 |
Austin
|
18 | 17 | 4 | 6 | 7 | 22 | 25 | -3 |
| 15 |
Sporting KC
|
14 | 17 | 3 | 5 | 9 | 24 | 35 | -11 |
| # | Team | Pts | P | W | D | L | GF | GA | GD |
|---|---|---|---|---|---|---|---|---|---|
| 1 |
Whitecaps
|
29 | 17 | 8 | 5 | 4 | 30 | 18 | 12 |
| 2 |
Dallas
|
26 | 17 | 7 | 5 | 5 | 30 | 28 | 2 |
| 3 |
Earthquakes
|
26 | 17 | 7 | 5 | 5 | 27 | 25 | 2 |
| 4 |
St. Louis
|
23 | 17 | 6 | 5 | 6 | 23 | 25 | -2 |
| 5 |
Houston
|
22 | 17 | 6 | 4 | 7 | 24 | 28 | -4 |
| 6 |
Minnesota
|
22 | 17 | 6 | 4 | 7 | 31 | 36 | -5 |
| 7 |
Sounders
|
18 | 17 | 4 | 6 | 7 | 18 | 23 | -5 |
| 8 |
Galaxy
|
17 | 17 | 4 | 5 | 8 | 24 | 36 | -12 |
| 9 |
Austin
|
16 | 17 | 4 | 4 | 9 | 20 | 40 | -20 |
| 10 |
LAFC
|
16 | 17 | 3 | 7 | 7 | 20 | 22 | -2 |
| 11 |
Portland
|
15 | 17 | 4 | 3 | 10 | 25 | 33 | -8 |
| 12 |
San Diego
|
15 | 17 | 3 | 6 | 8 | 20 | 33 | -13 |
| 13 |
Sporting KC
|
12 | 17 | 4 | 0 | 13 | 16 | 46 | -30 |
| 14 |
Salt Lake
|
12 | 17 | 3 | 3 | 11 | 20 | 30 | -10 |
| 15 |
Colorado
|
10 | 17 | 2 | 4 | 11 | 16 | 31 | -15 |
| # | Team | Pts | P | W | D | L | GF | GA | GD |
|---|---|---|---|---|---|---|---|---|---|
| 1 |
St. Louis
|
60 | 34 | 16 | 12 | 6 | 31 | 15 | 16 |
| 2 |
Whitecaps
|
56 | 34 | 16 | 8 | 10 | 38 | 18 | 20 |
| 3 |
Earthquakes
|
51 | 34 | 13 | 12 | 9 | 30 | 22 | 8 |
| 4 |
Dallas
|
50 | 34 | 12 | 14 | 8 | 30 | 26 | 4 |
| 5 |
Salt Lake
|
50 | 34 | 12 | 14 | 8 | 27 | 23 | 4 |
| 6 |
Colorado
|
50 | 34 | 12 | 14 | 8 | 21 | 17 | 4 |
| 7 |
Houston
|
49 | 34 | 12 | 13 | 9 | 20 | 18 | 2 |
| 8 |
Portland
|
43 | 34 | 12 | 7 | 15 | 30 | 35 | -5 |
| 9 |
LAFC
|
43 | 34 | 11 | 10 | 13 | 22 | 19 | 3 |
| 10 |
San Diego
|
42 | 34 | 10 | 12 | 12 | 26 | 34 | -8 |
| 11 |
Galaxy
|
41 | 34 | 10 | 11 | 13 | 25 | 31 | -6 |
| 12 |
Austin
|
40 | 34 | 8 | 16 | 10 | 15 | 20 | -5 |
| 13 |
Sounders
|
36 | 34 | 7 | 15 | 12 | 16 | 20 | -4 |
| 14 |
Sporting KC
|
32 | 34 | 8 | 8 | 18 | 22 | 39 | -17 |
| 15 |
Minnesota
|
30 | 34 | 7 | 9 | 18 | 18 | 33 | -15 |
Toronto
Cincinnati
Toronto
Colorado
Toronto
Columbus
Toronto
New York
Cincinnati
Toronto
Austin
Galaxy
Inter Miami
Austin
Austin
LAFC
Salt Lake
Austin
Charlotte
Austin